Issue
Tools and resources for analyzing the use of the various injury severity fields and values in your crash data
Explanation
The complete details of the various Colorado crash severity fields, as used in Crash Magic, are described here: Colorado overall crash severity
To help you analyze the extent and use of the various severity codes in your Colorado crash data, we’ve created some resources in Crash Magic.
- Available resources:
- Category list / Severity Calculated
- Category set / Collisions by year v Severity Calculated
- Category set / Harmfulevent1 v Severity Calculated
- Category set / MHE v Severity Calculated
- Field list / Pd Injury Severity fields
- Chart / Severity Calculated
- Crosstab / Calculated Severity by Year
- Crosstab / Calculated Severity by Year NE. Show empty columns = false
- Crosstab / PdSeverityVYear
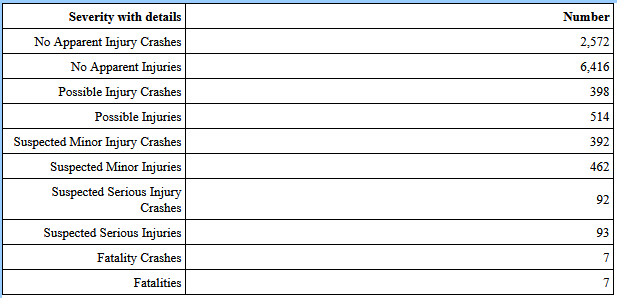
- Frequency report / Severity with details – This frequency report displays crash type count and and the actual injury count for each KABCO severity value. In this example, there were 398 crashes where the highest severity was “Possible Injury”. Then it shows that there were 514 occupants with a severity of “Possible Injury”. Important: It is entirely possible to have a crash categorized with a high severity that also has occupants with some low severity values. For example a crash with one “Serious Injury” and three “Possible Injury” occupants, will add 3 to the “Possible Injuries”, 0 to the “Possible Injury Crashes” and 1 to the “Suspected Serious Injury Crashes”.
For additional information, there is a KB article specifically for this report: Colorado Severity Calculated category list
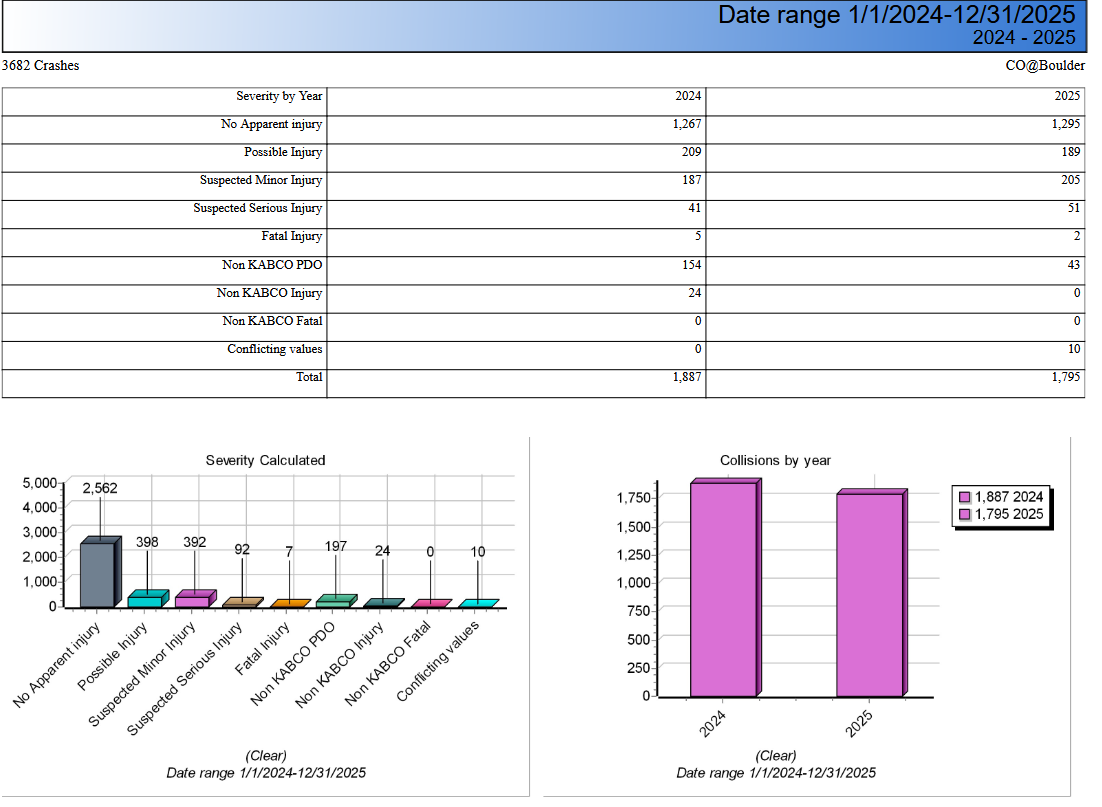
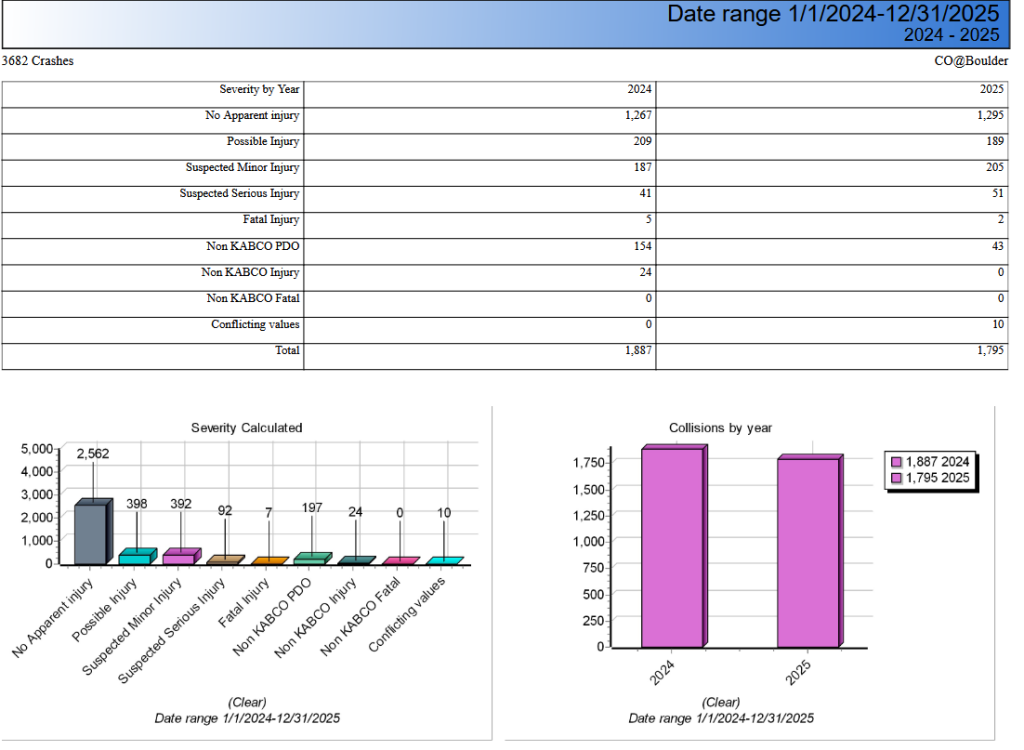
- Layout report / Pd DB severity summary – This layout includes the “Severity with details” by year as well as the “Severity Calculated” and “Collisions By Year” charts.
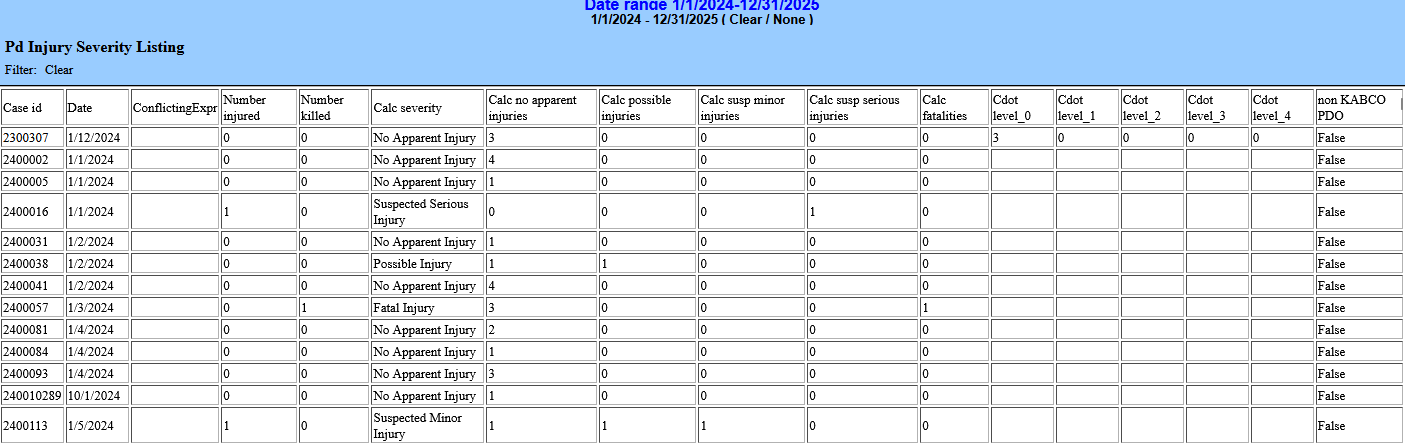
- Tabular report / Pd Injury Severity Listing – The Pd Injury Severity Listing tabular report shows every one of the severity values for each crash. It is useful in identifying how a crash has been coded. The Calc Severity column is the one that will be respected by the program.
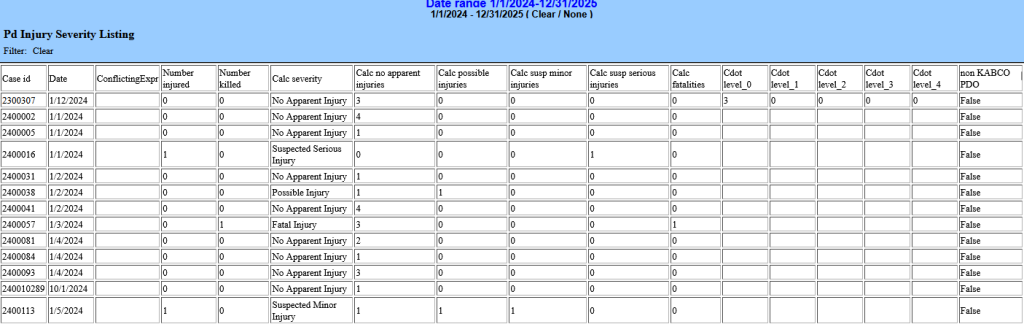
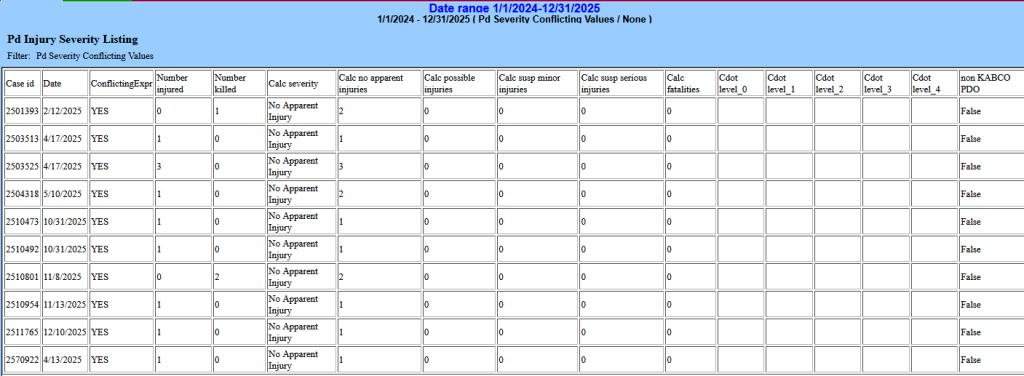
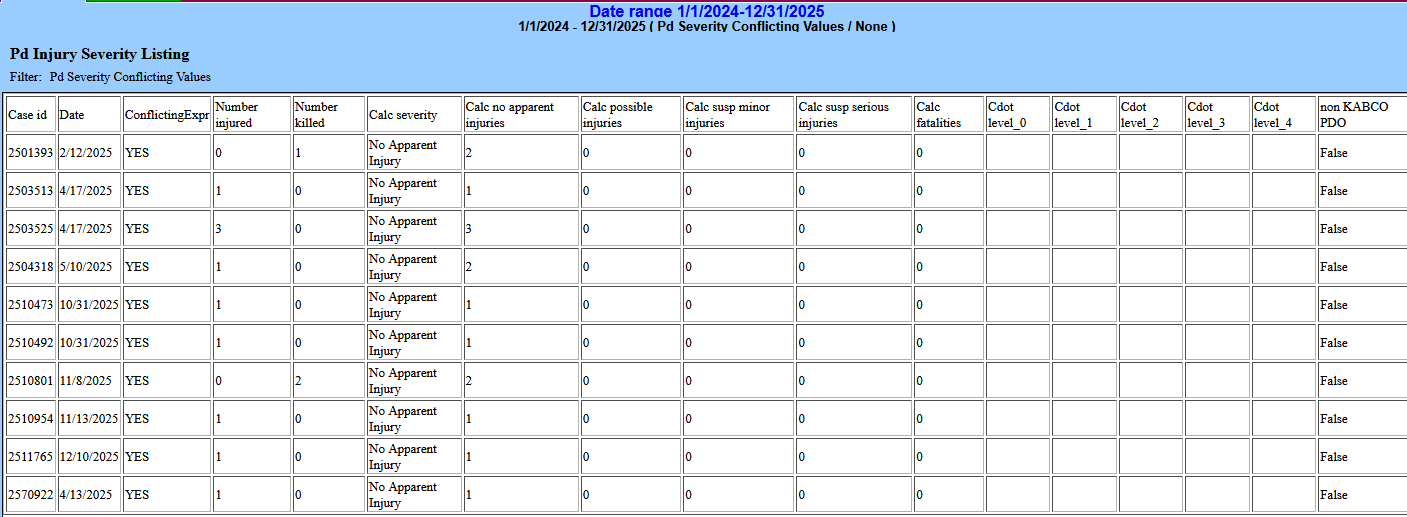
- Tabular report / Pd Injury Severity Listing – Filtered with “Pd Severity Conflicting Values” – By filtering the listing by conflicting values, the report lists those crashes where multiple severity fields are coded with values that conflict with each other. This is the listing + filter to use in determining which data needs cleaning in order to avoid potentially creating reports that don’t agree with each other.